
Product Overview
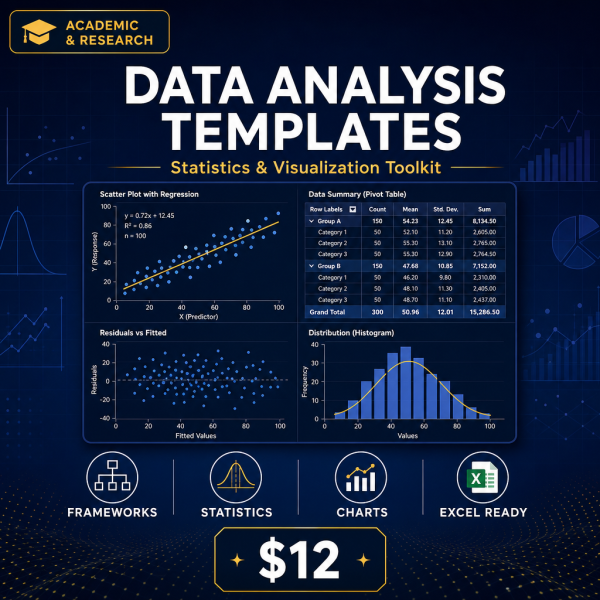
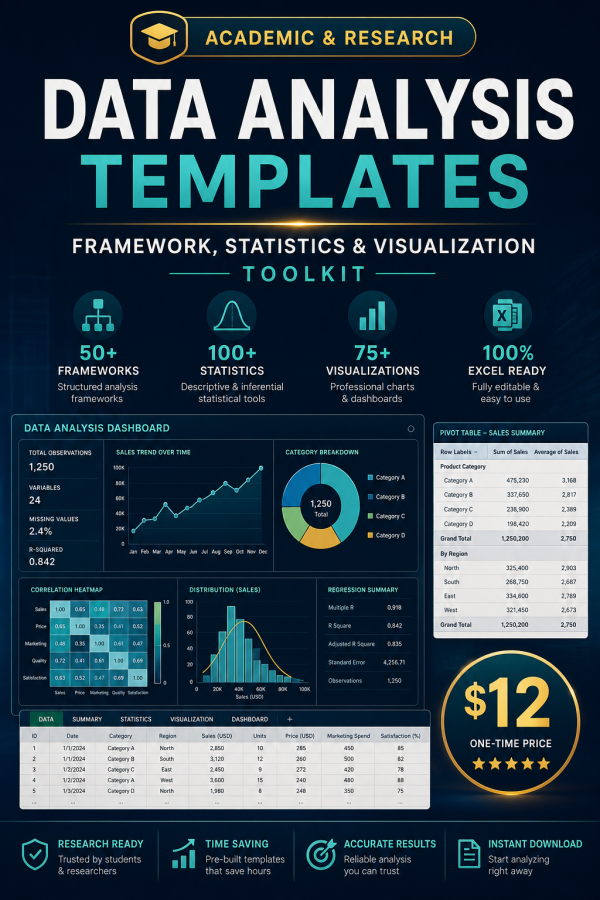
Most data analysis stalls at the same three points: messy raw data, uncertainty about which statistical test or chart actually fits the question, and reports that take hours to rebuild by hand. The Data Analysis Templates toolkit tackles all three with a framework guide, a statistical methods reference, a visualization guide and a survey design guide, plus editable spreadsheets you can drop your own numbers into.
It is built to work for academic research, internal business reporting or freelance analysis work, with a licence that covers commercial use.
Key Features
- Data Analysis Framework Guide — a repeatable process for moving from raw data to a defensible conclusion.
- Statistical Methods Quick Reference — a guide to choosing and interpreting common statistical tests.
- Data Visualization Best Practices — how to pick the right chart type for the story your data is telling.
- Survey Research Design Guide — structure survey instruments so the data you collect is actually usable.
- Data Cleaning Template (XLSX) — a structured starting point for standardizing and checking raw data.
- Statistical Analysis Dashboard (XLSX) — organize calculations and summary statistics in one workbook.
- KPI Metrics Tracker (XLSX) — track business or research metrics over time in one place.
- SQL Cheat Sheet (bonus) — core query syntax for pulling and filtering data.
- Python Data Analysis Reference (bonus) — common pandas and analysis patterns for when spreadsheets are not enough.
What’s Included
12 files, delivered as one ZIP (PDF, XLSX, MD, TXT).
- Product/ — Data_Analysis_Framework_Guide.pdf, Statistical_Methods_Quick_Reference.pdf, Data_Visualization_Best_Practices.pdf, Survey_Research_Design_Guide.pdf
- Editable/ — Data_Cleaning_Template.xlsx, Statistical_Analysis_Dashboard.xlsx, KPI_Metrics_Tracker.xlsx
- Bonus/ — SQL_Cheat_Sheet.pdf, Python_Data_Analysis_Reference.pdf
- Documentation/ — Quick_Start_Guide.pdf, README.md
- License/ — License.txt
Who This Is For
- Students and researchers — who need a clear framework and statistics reference for a thesis, paper or class project.
- Small business owners — tracking KPIs without a dedicated analytics platform.
- Freelance analysts and consultants — who want a repeatable process and templates for client work.
- Survey researchers — designing instruments before collecting responses.
- Anyone learning SQL or Python for analysis — who wants a quick reference alongside spreadsheet work.
Why Choose This Product
- Covers the full workflow — from raw, messy data through statistics, visualization and reporting.
- Academic and business ready — the same framework supports a thesis chapter or a KPI dashboard for a small team.
- Commercial licence included — use the templates in paid client or internal business work.
- Grows with your skills — SQL and Python references are included for when spreadsheets stop being enough.
How To Use
- Unzip the download and open Documentation/Quick_Start_Guide.pdf for a map of every file.
- Read Data_Analysis_Framework_Guide.pdf first to set up your overall process.
- Drop your raw data into Data_Cleaning_Template.xlsx, then move cleaned data into Statistical_Analysis_Dashboard.xlsx.
- Use Statistical_Methods_Quick_Reference.pdf and Data_Visualization_Best_Practices.pdf to choose the right test and chart for your results.
- Track ongoing metrics in KPI_Metrics_Tracker.xlsx and reference the SQL and Python guides as your analysis needs grow.
Frequently Asked Questions
What format are the files? One ZIP with 12 files: six PDF guides and references, three editable XLSX templates, plus a README (MD) and licence (TXT).
Can I edit the files? Yes. The three XLSX templates are fully editable, and you can adapt formulas, labels and layout to your own data. The PDF guides are reference material and are not designed to be edited.
What software do I need? A PDF reader and a spreadsheet app such as Excel, Google Sheets or LibreOffice Calc. The SQL and Python references assume access to a database or Python environment if you choose to use them.
Is this for personal or commercial use? Both. The licence permits personal and commercial use, including internal business reporting and client work. Resale, redistribution and repackaging of the files are not permitted.
What is the refund policy? This is a digital download and is non-refundable once downloaded. If a file is missing or corrupted, contact us and we will send a replacement.
Do I need to know statistics already to use this? No. The Statistical Methods Quick Reference explains what each common test is used for in plain language before you apply it.
Will this work for survey data specifically? Yes, the Survey Research Design Guide is written specifically for structuring survey instruments and preparing that data for analysis.
Is this suitable for business reporting, not just academic research? Yes, the KPI Metrics Tracker and framework guide are written to apply equally to business dashboards and research projects.
Bonus Materials
Two extras are included at no additional cost: the SQL Cheat Sheet, covering the query syntax you need to pull and filter data from a database, and the Python Data Analysis Reference, a quick guide to common pandas patterns for when a project outgrows a spreadsheet. Both are written as a bridge for analysts moving beyond manual spreadsheet work.





Reviews
There are no reviews yet.